5.5 Application on real data: rhizosphere of Medicago truncatula
5.5.1 Material
In order to study the interactions between Medicago truncatula and the microbial community of its rhizosphere, a core collection of 154 accessions have been analysed. The purpose of the study is to identify significant interactions between the plant genome and the microbial metagenome to better understand the effect of the microbial community on the growth of the plant.
Each accession was grown in a controlled environment and phenotyped for several traits related to the growth and nutritional strategy:
Measure of total biomass (BMtot).
Root Shoot Ratio (RTR).
Specific Nitrogen Uptake (SNU). It is the correlation between the total amount of nitrogen and below-ground biomass
The distributions of the phenotypic values are shown in Figure 5.7.
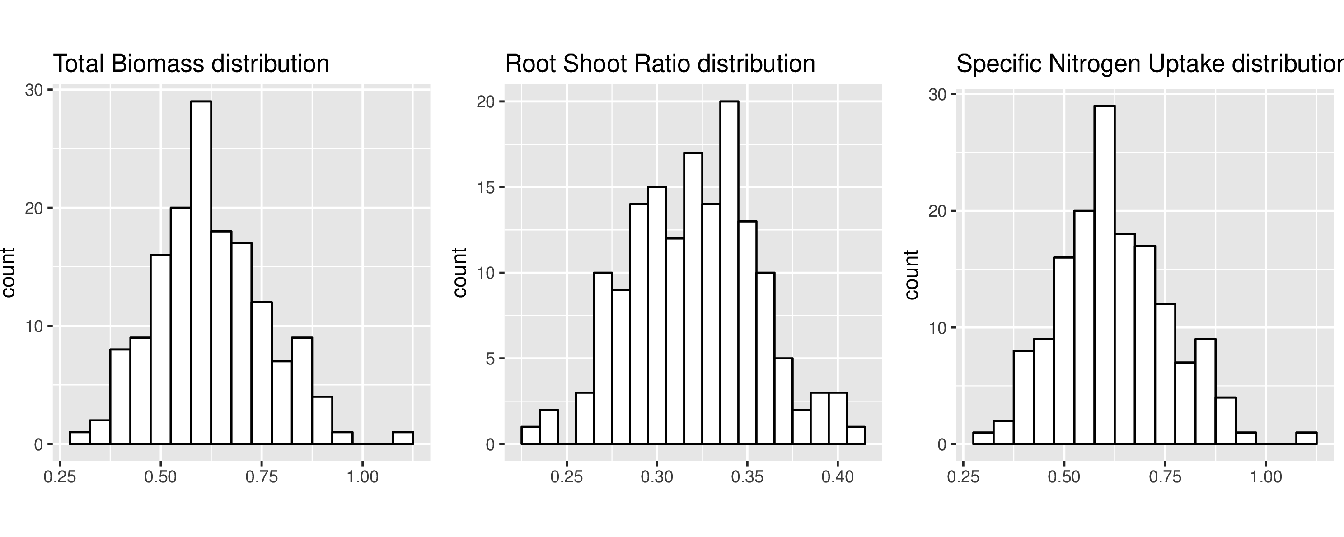
Figure 5.7: Distribution of the phenotypic values for the BMtot, RTR and SNU traits.
In addition to the phenotypic measurement, the rhizosphere of each accession was also analysed to determine the microbial diversity in terms of number of species and abundance of each species. The metagenomic composition of the rhizosphere has been analysed by DNA extraction and shotgun sequencing. A total of 848 different species were found in the rhizosphere of the plants (repartition shown in Figure 5.8).
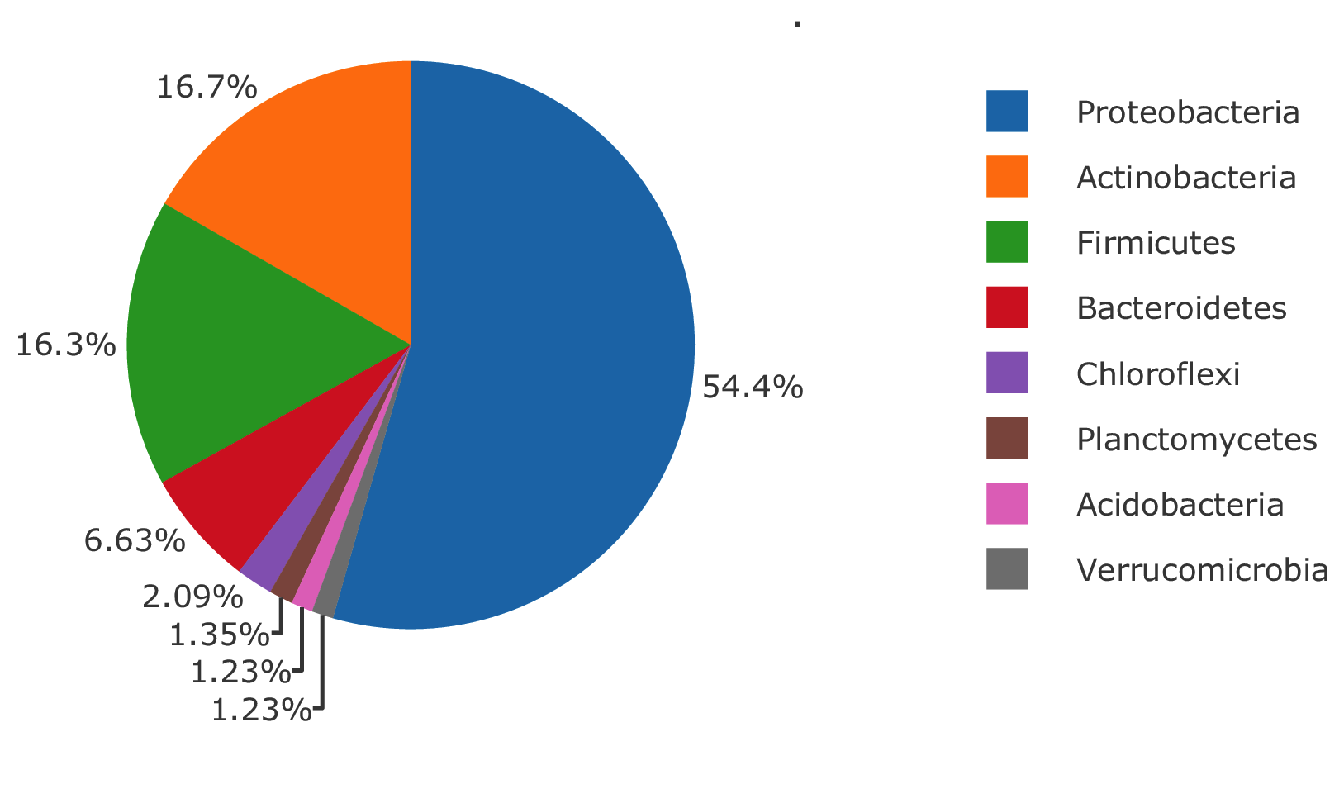
Figure 5.8: Distribution of the phenotypic values for the BMtot, RTR and SNU traits.
Finally, 154 accession were genotyped with a DNA microarray chip for a
total number of 6 372 968 SNP. The missing values were imputed using the
‘snp.imputation‘ function from the SNPstats R package. Given two set
of SNP typed in the same subjects, this function calculates rules which
can be used to impute one set from the other in a subsequent sample.
Some SNP having too many missing values to be imputed at \(100\%\), we only kept the SNP which have been completely imputed, thus reducing the size of the data to 2 148 505 SNP. We also looked at the linkage disequilibrium level among some SNP to get an overview of the genome structure (Figure 5.9).
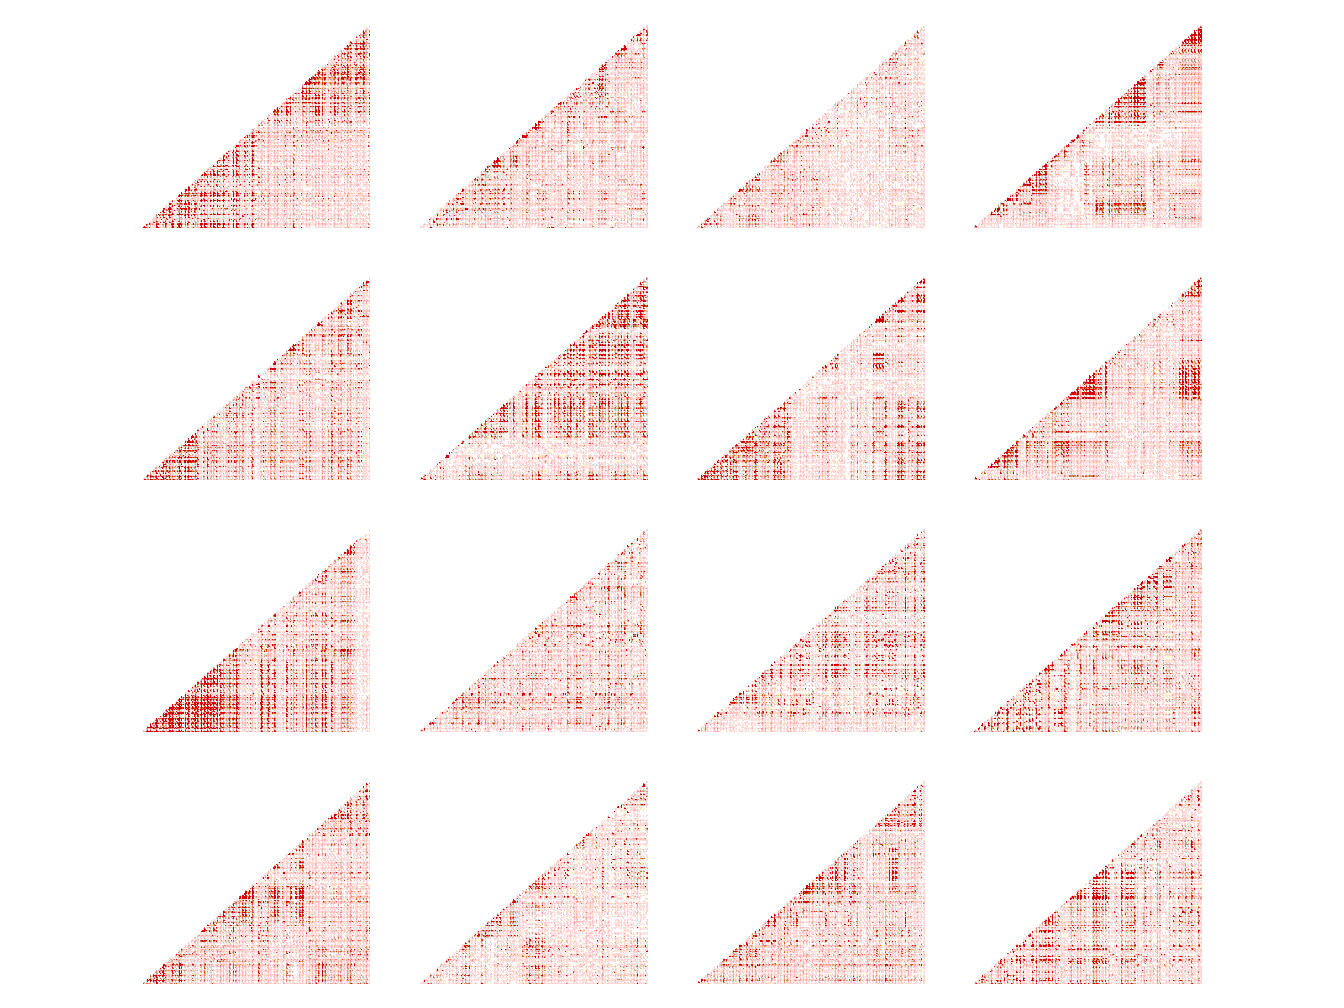
Figure 5.9: Heatmap of LD level among SNP of chromosome 4 (position 17448921 to 22706884).
5.5.2 Analysis
The algorithm SICOMORE requires that we choose several hyper-parameters in order to run properly:
Aggregating function: For both metagenomic and genomic data we define the mean value of the group as supervariable.
Clustering algorithm: For the metagenomic data we used 2 types of clustering: a hierarchical clustering using Ward’s distance as the measure of similarity and a phylogenetic clustering using the taxonomic information to construct a tree. The first method does not use information a priori while the second uses phylogenetic information to build a tree. For the genomic data, we used spatially constrained hierarchical clustering algorithm which integrates the linkage disequilibrium as the measure of dissimilarity. It is also possible not to specify any hierarchy for one the 2 datasets, in that case we are looking for interaction between groups of variables in one dataset and single variables in the second dataset.
Search space: For computational reasons, we searched at first for interaction between a subset of the SNP data and the metagenomic data. We chose arbitrarily a subset of \(10\%\) of the initial data matrix (214 851 SNP). We also chose to divide the analysis chromosome by chromosome.
To summarize we performed an exhaustive search for interaction by setting different parameters:
Option 1 : Hierarchical clustering on metagenomic data + spatially constrained hierarchical clustering on subset of genomic data (214 851 SNP) + chromosome by chromosome.
Option 2 : Hierarchical clustering on metagenomic data + spatially constrained hierarchical clustering on subset of genomic data (214 851 SNP) + all chromosomes combined.
Option 3 : Hierarchical clustering on metagenomic data + spatially constrained hierarchical clustering on all genomic data (2 148 505 SNP) + chromosome by chromosome.
Option 4 : Phylogenetic clustering using taxonomic information on metagenomic data + spatially constrained hierarchical clustering on subset of genomic data (214 851 SNP) + chromosome by chromosome.
5.5.3 Results
5.5.3.1 Results on Total Biomass
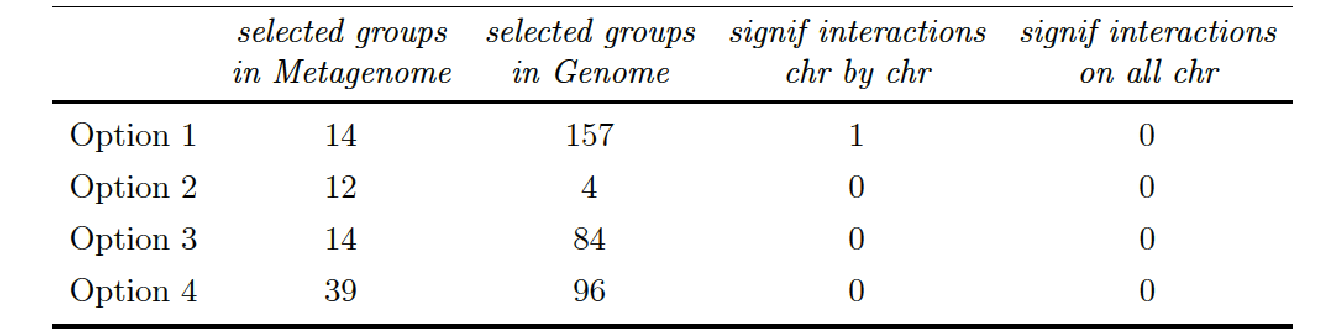
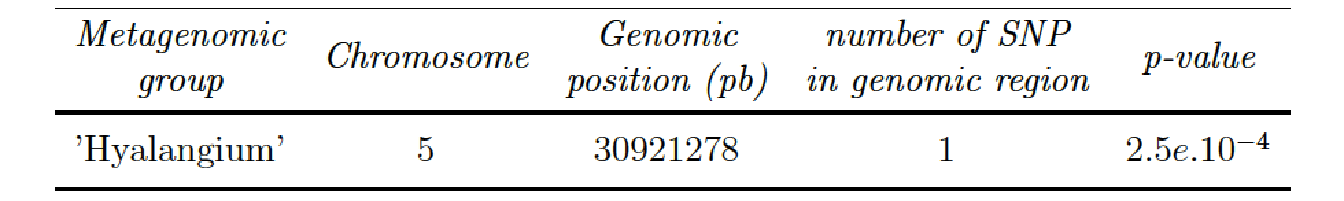
One significant interaction was found for the phenotype Total Biomass when we applied a BH correction chromosome by chromosome (column 3) instead of correcting on the all set of p-value, all chromosome confounded:
5.5.4 Results on Root Shoot Ratio
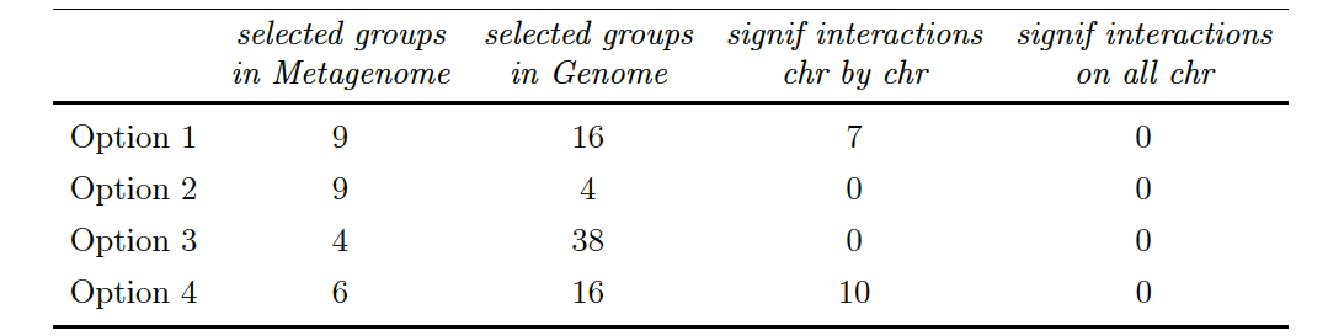
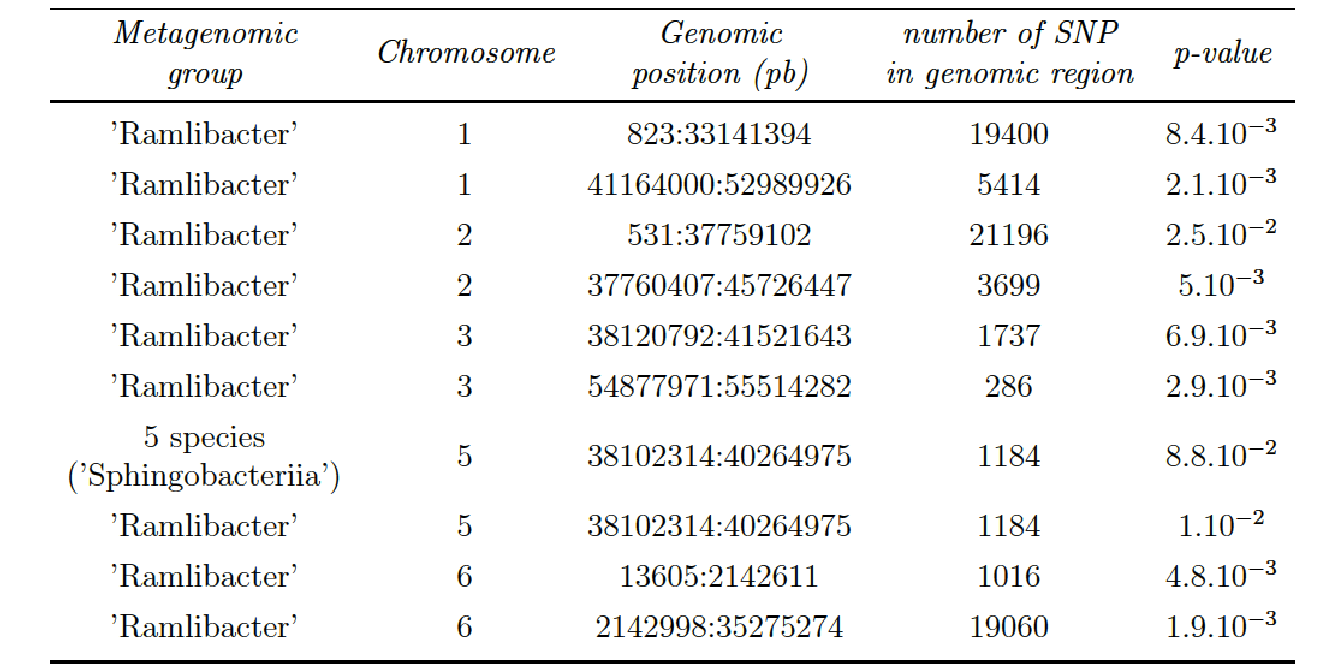
We found some significant interactions when we applying a BH correction chromosome by chromosome (column 3). We observe different results according to the clustering applied on the metagenomic data. We found 7 significant interactions for the phenotype Root Shoot Ratio when we applied a hierarchical clustering and 10 significant interactions when we applied a phylogenetic clustering.
- Option 1 (hierarchical clustering on Metagenomic data and subset of SNP data):
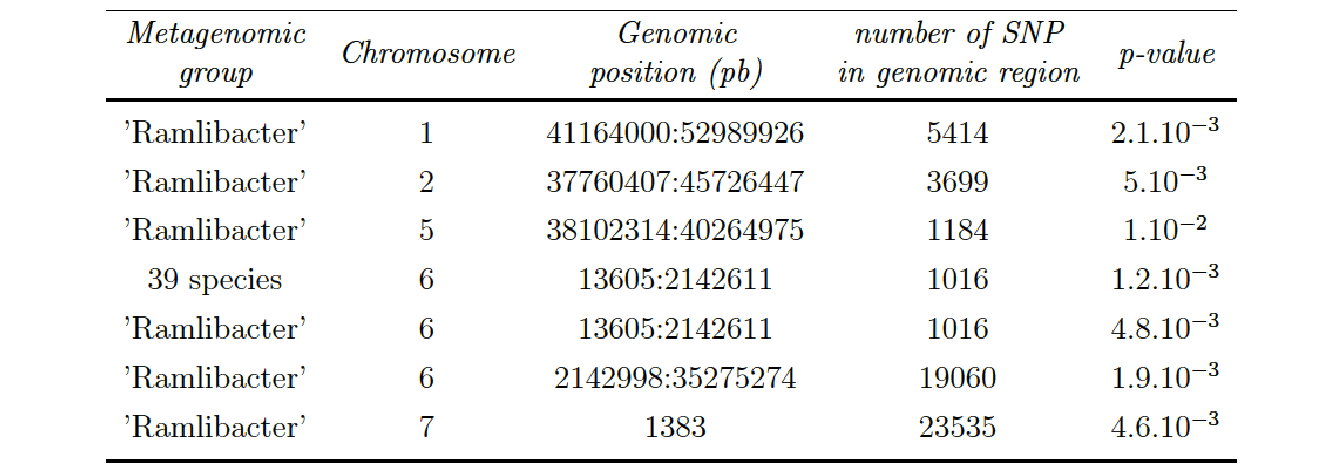
- Option 4 (phylogenetic clustering on Metagenomic data and subset of SNP data):
5.5.5 Results on Specific Nitrogen Uptake
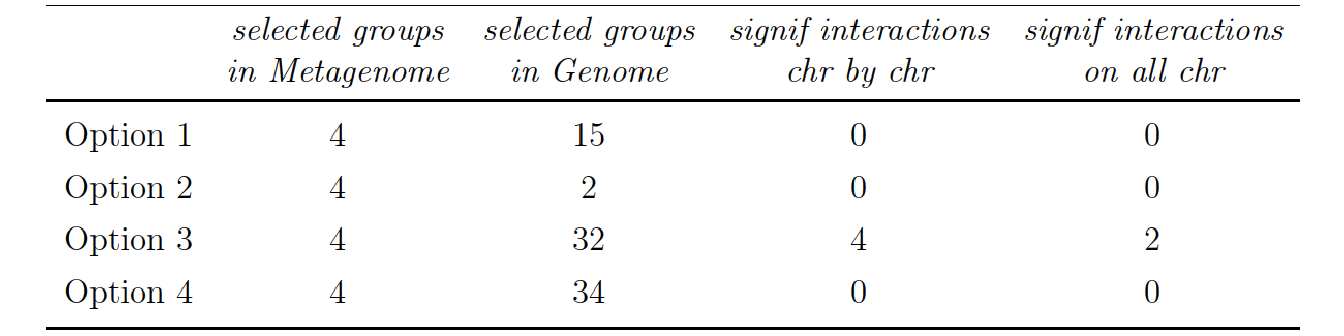
2 significant interactions (on a total 128 potential interactions) were found between 2 groups of microbial species and 2 groups of SNP when assessing all the genomic data (Option 4) and applying the BH correction on the all set of p-value:
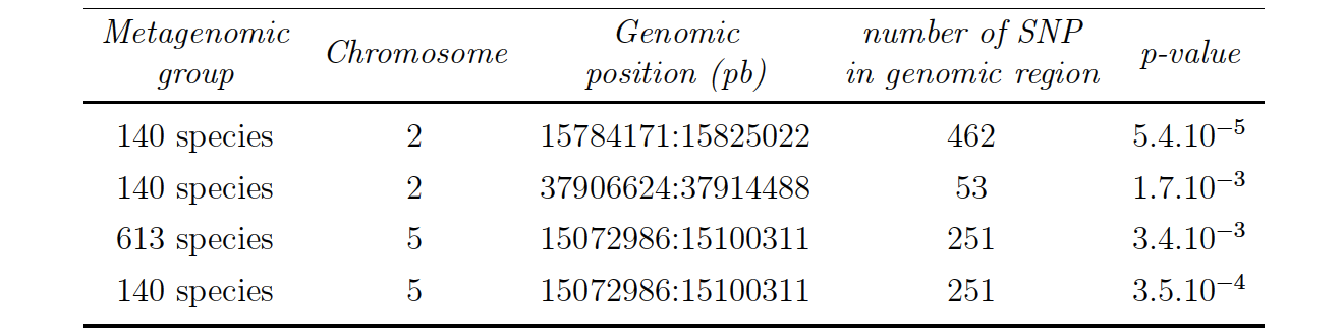
The 140 microbial species found in the interactions with chromosome 2 and 5 are the same species. The repartition in phylum of these species are illustrated in Figure 5.10, there is a total of 13 phylum represented with a vast majority of Proteobacteria.
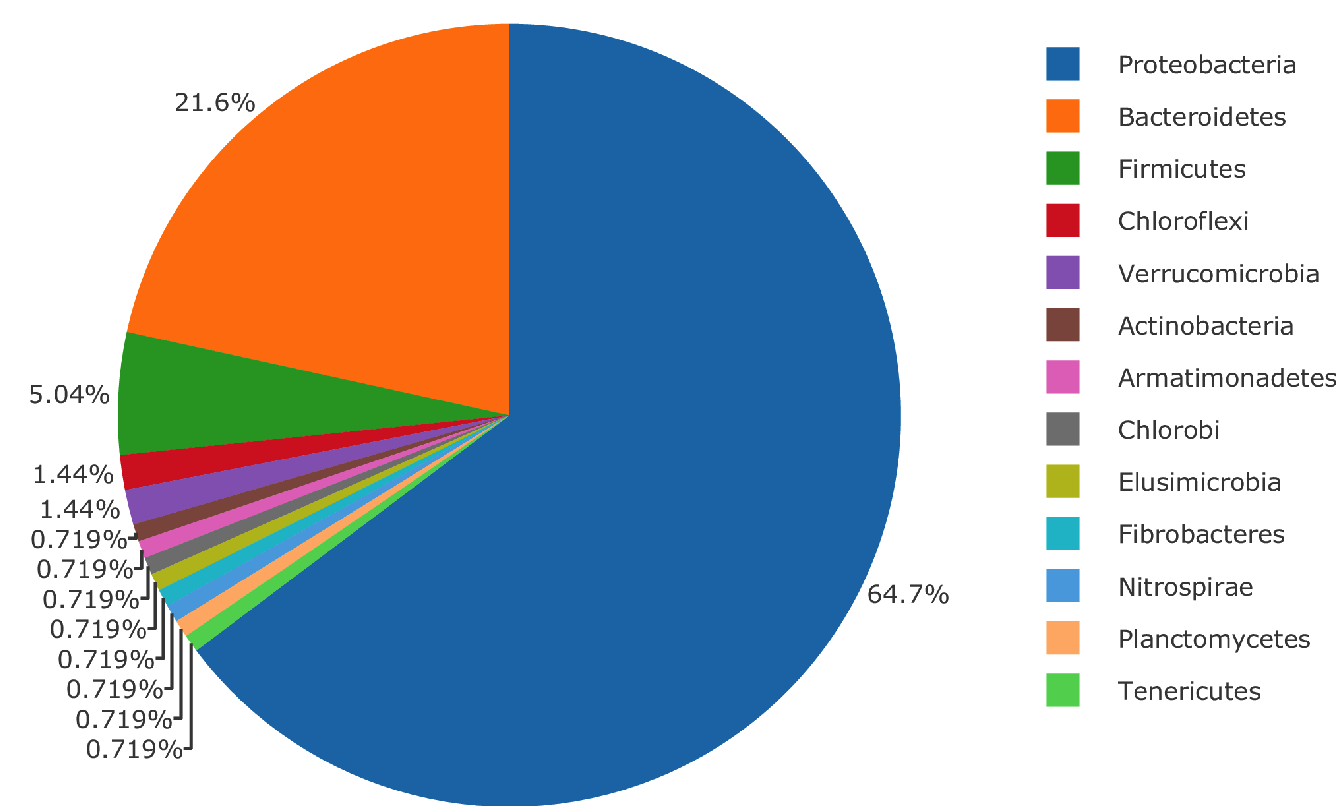
Figure 5.10: Microbial phylum found in interaction with chromosome 2 and chromosome 5 of Medicago truncatula for the Specific Nitrogen Uptake phenotype.