1.7 Structure of haplotype blocks in the human genome
The distribution of linkage disequilibrium patterns along the genome can be seen as being noisy and unpredictable. For example, pairs of loci that are tens of kilobases apart might be in complete LD due to population structure or population size for instance, whereas nearby loci from the same region might be in weak LD if close to a recombination hotspot for instance (Wall and Pritchard 2003).
It is often observed that LD in non-African populations extends over longer distances than in Africans, which might reflect a population bottleneck at the time when modern humans first left Africa (Frisse et al. 2001; Reich et al. 2001). Similarly, there have been reports that certain isolated or admixed populations show LD over large distances (Laan and Pääbo 1997; Kaessmann et al. 2002).
However, despite the apparent complexity of observed patterns, some studies have proposed that the underlying structure of LD in the human genome can be described using a relatively simple framework in which the data are parsed into a series of discrete haplotype blocks (Daly et al. 2001; Gabriel et al. 2002), neighbouring blocks being separated by regions of numerous recombination events (Daly et al. 2001).
In response to these results, the United States National Human Genome Research Institute initiated a project, called the International HapMap Project, which aims to create a genome-wide map of LD and haplotype blocks. The HapMap Project seeks identify chromosomal regions where genetic variants are shared by comparing the DNA sequences among individuals. There are approximately ten million SNP estimated to be present in the human genome. Testing all of these SNP in chromosomes of individuals, however, can be extremely expensive and cost-inefficient. The development of the HapMap enables geneticists to take the advantage of how SNP and other genetic variants are organized on the same chromosome.
The number of tag SNP that capture most of the information of genetic variation patterns is estimated to be between 300,000 and 600,000, far fewer than the ten million common SNP.
Definition of haplotype blocks
A definition of haplotype block has been proposed by (Gabriel et al. 2002) where they focused on \(|D'|\) measure of LD and defined haplotype blocks as sets of consecutive sites between which there is little or no evidence of historical recombination. For each pair of loci, the data are used to construct a confidence interval on the population value of \(|D'|\) and the values of \(|D'|\) are thus divided into three categories:
strong LD: \(|D'|\) near 1, which implies little or no evidence of historical recombination;
weak LD: \(|D'|\) significantly \(< 1\), implying historical recombination;
intermediate/unknown LD: The category includes pairs of sites with intermediate values of \(|D'|\), as well as pairs for which the confidence intervals are relatively wide.
Two or more sites can be grouped together into a block if the outermost pair of sites is in strong LD, and if, for all pairwise comparisons in the block, the number of pairs in strong LD is at least 19-folds greater than the number of pairs in weak LD.
Patterns in human genome
To illustrate the patterns of LD in human genome, we refer to the results obtained by (Gabriel et al. 2002) where they characterized haplotype patterns across 51 autosomal regions (spanning 13 megabases of the human genome) in samples from Africa, Europe, and Asia and the analysis of these data by (Wall and Pritchard 2003).
In Figure 1.9 are represented, for 4 different samples of population, the total proportions of sequence that was contained in haplotype blocks of various sizes. The results show that both the European-American and East Asian population samples have more extensive haplotype blocks than the African-American and sub-Saharan African samples and it is worth mentioning that in all four populations less than half of the total sequence is contained in identified haplotype blocks.
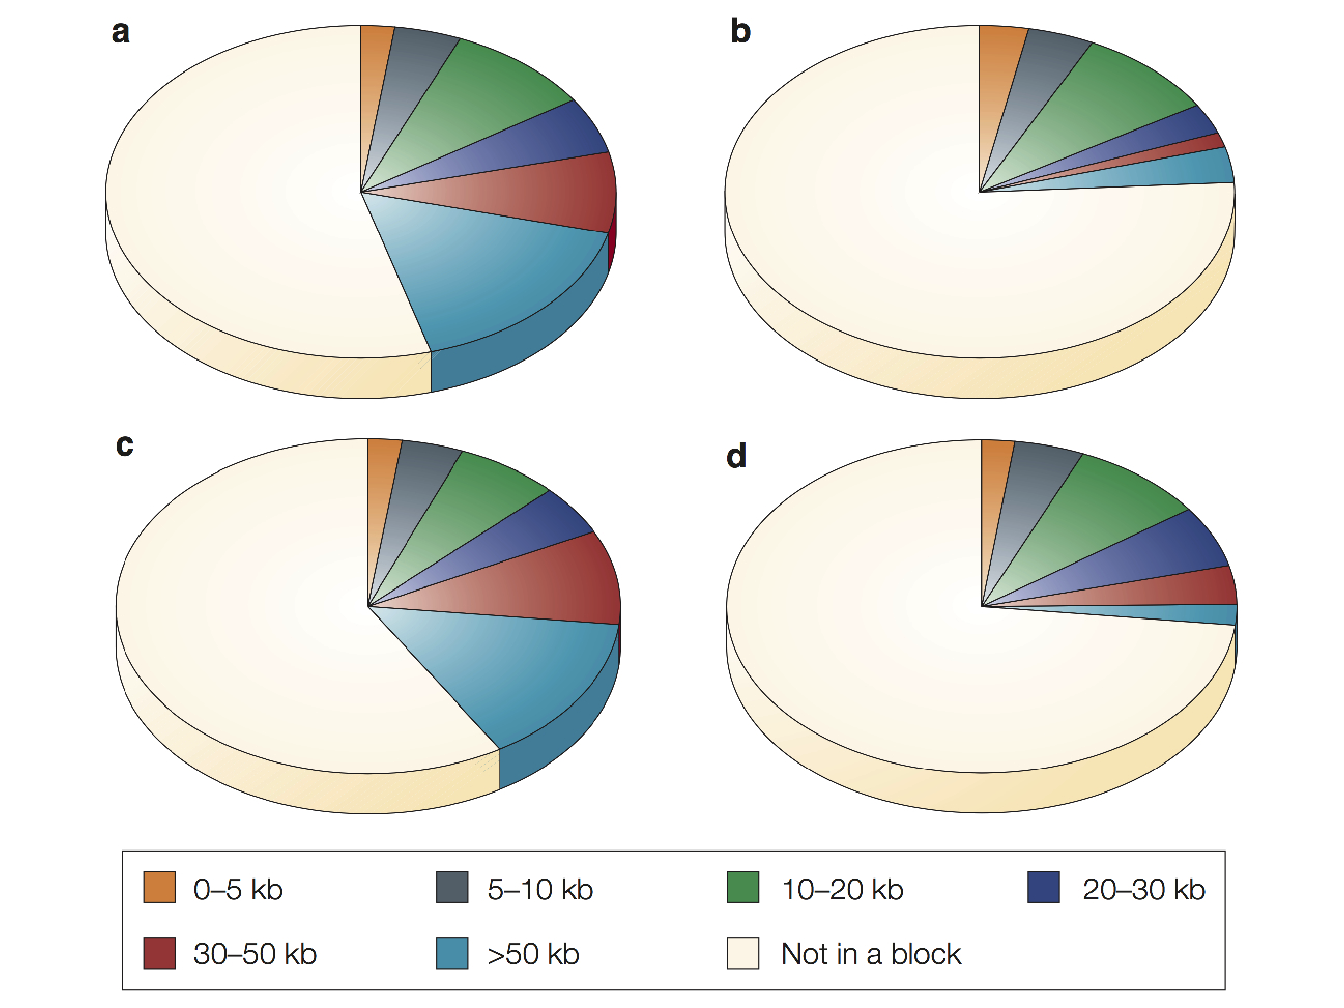
Figure 1.9: Proportion of sequence contained in haplotype blocks of various sizes from (Wall and Pritchard 2003). (a) European-American sample; (b) African-American sample; (c) East Asian sample; (d) Sub-Saharan African sample.
In Figure 1.10 are represented the values of \(|D'|\) for all pairs of markers in a region. In this type of representation, the haplotype blocks appear as triangular regions of red (or light brown) squares that along the diagonal. These plots highlight the strong heterogeneity of LD within same regions: areas of strong LD that correspond well to the haplotype-block definition are often surrounded by equally large regions with little or no LD.
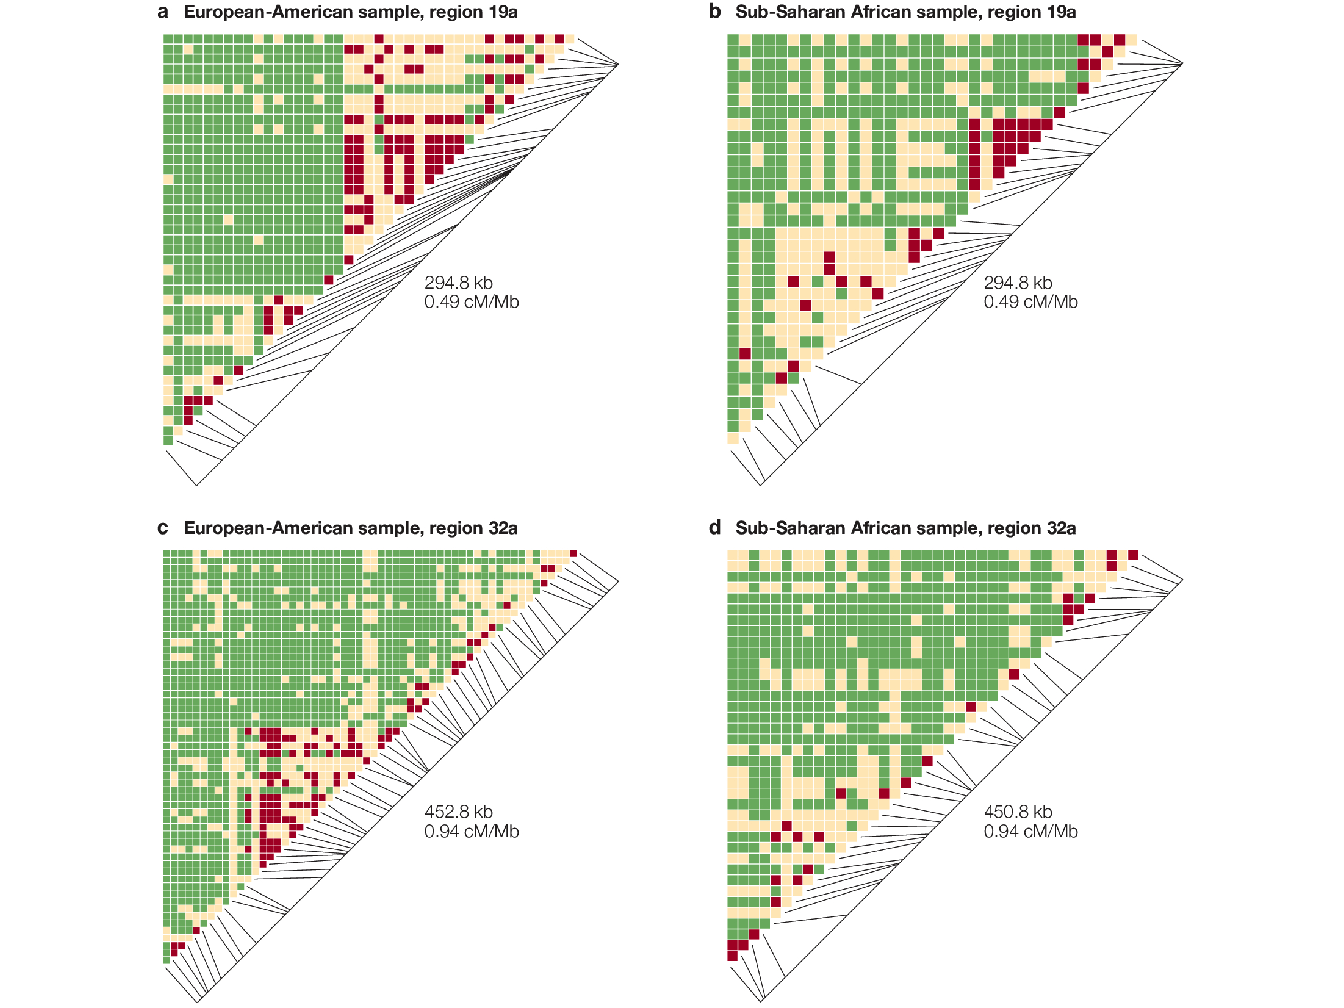
Figure 1.10: Pairwise \(\mid D' \mid\) plots for representative regions from different population samples from (Wall and Pritchard 2003). Each square in the triangle plots the level of linkage disequilibrium (LD) between a pair of sites in a region; comparisons between neighbouring sites lie along the diagonal. Red color indicates strong LD, green indicates weak LD and light brown indicates intermediate or uninformative LD. The long diagonal line indicates the physical length of the region, and the short black lines plot the position of each marker in this region.
References
Daly, Mark J, John D Rioux, Stephen F Schaffner, Thomas J Hudson, and Eric S Lander. 2001. “High-Resolution Haplotype Structure in the Human Genome.” Nature Genetics 29 (2): 229.
Frisse, L, RR Hudson, A Bartoszewicz, JD Wall, J Donfack, and A Di Rienzo. 2001. “Gene Conversion and Different Population Histories May Explain the Contrast Between Polymorphism and Linkage Disequilibrium Levels.” The American Journal of Human Genetics 69 (4): 831–43.
Gabriel, S. B., S. F. Schaffner, H. Nguyen, J. M. Moore, J. Roy, B. Blumenstiel, J. Higgins, et al. 2002. “The Structure of Haplotype Blocks in the Human Genome.” Science 296 (5576): 2225–9.
Kaessmann, Henrik, Sebastian Zöllner, Anna C Gustafsson, Victor Wiebe, Maris Laan, Joakim Lundeberg, Mathias Uhlén, and Svante Pääbo. 2002. “Extensive Linkage Disequilibrium in Small Human Populations in Eurasia.” The American Journal of Human Genetics 70 (3): 673–85.
Laan, Maris, and Svante Pääbo. 1997. “Demographic History and Linkage Disequilibrium in Human Populations.” Nature Genetics 17 (4): 435.
Reich, David E, Michele Cargill, Stacey Bolk, James Ireland, Pardis C Sabeti, Daniel J Richter, Thomas Lavery, et al. 2001. “Linkage Disequilibrium in the Human Genome.” Nature 411 (6834): 199.
Wall, Jeffrey D, and Jonathan K Pritchard. 2003. “Haplotype Blocks and Linkage Disequilibrium in the Human Genome.” Nature Reviews Genetics 4 (8): 587.